
使用 Kandy 進行資料視覺化
Kotlin 為強大且靈活的資料視覺化提供了全方位的一站式解決方案,在深入研究複雜模型之前,提供了一種直觀的方式來呈現和探索資料。
本教學示範如何在 IntelliJ IDEA 中使用 Kandy 與 Kotlin DataFrame 程式庫建立不同的圖表類型。
開始之前
自 IntelliJ IDEA 2026.2 起,Kotlin Notebook 將不再與 IDE 隨附打包,JetBrains 也不再提供官方支援。 原始碼將繼續保留在 GitHub 上。
欲了解更多資訊,請參閱部落格文章。
若要依照本教學操作:
選取 File | New | Kotlin Notebook。
在您的 Notebook 中匯入 Kandy 和 Kotlin DataFrame:
kotlin%use kandy %use dataframe請在任何其他程式碼資料格之前執行包含
%use dataframe行的程式碼資料格, 以確保 DataFrame 程式庫及其 API 在 Notebook 中可用。
若要依照本教學操作,您也可以將 DataFrame 作為 Gradle 或 Maven 相依性使用。
建立 DataFrame
首先,讓我們建立一個包含要視覺化之資料的 DataFrame。此 DataFrame 儲存了 柏林、馬德里和卡拉卡斯的模擬每月平均氣溫:
// months 變數儲存包含一年 12 個月份的清單
val months = listOf(
    "January", "February",
    "March", "April", "May",
    "June", "July", "August",
    "September", "October", "November",
    "December"
)
// tempBerlin、tempMadrid 和 tempCaracas 變數儲存
// 每個月份氣溫值的清單
val tempBerlin =
    listOf(-0.5, 0.0, 4.8, 9.0, 14.3, 17.5, 19.2, 18.9, 14.5, 9.7, 4.7, 1.0)
val tempMadrid =
    listOf(6.3, 7.9, 11.2, 12.9, 16.7, 21.1, 24.7, 24.2, 20.3, 15.4, 9.9, 6.6)
val tempCaracas =
    listOf(27.5, 28.9, 29.6, 30.9, 31.7, 35.1, 33.8, 32.2, 31.3, 29.4, 28.9, 27.6)
現在讓我們建立一個新變數 (df),並使用 dataFrameOf() 函式 產生一個包含三欄(Month、Temperature 和 City)的 DataFrame:
val df = dataFrameOf(
    "Month" to months + months + months,
    "Temperature" to tempBerlin + tempMadrid + tempCaracas,
    "City" to List(12) { "Berlin" } + List(12) { "Madrid" } + List(12) { "Caracas" }
)
若要預覽資料,請使用 .head() 函式:
df.head(4) // 傳回前四列在我們的資料集中,前四列儲存了 柏林 1 月至 4 月的氣溫:
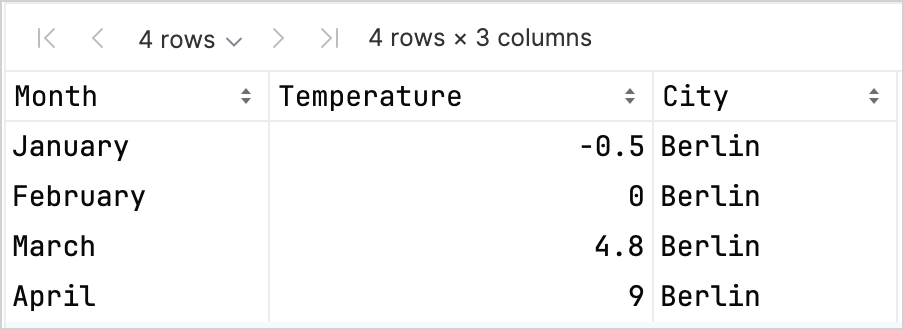
存取資料欄記錄有不同的選項,可協助您在同時使用 Kandy 和 Kotlin DataFrame 程式庫時提高型別安全性。 如需更多資訊,請參閱存取 API。
建立折線圖
讓我們使用上一節中的 df DataFrame 來建立折線圖:
- 呼叫 Kandy 程式庫中的
.plot()函式。 - 套用
line()圖層。 - 將
Month和Temperature欄對應至對應的X和Y軸。 - (選用)自訂顏色與大小。
df.plot {
   line {
      x(Month)
      y(Temperature)

      color(City) {
         scale = categorical(
            "Berlin" to Color.hex("#6F4E37"),
            "Madrid" to Color.hex("#C2D4AB"),
            "Caracas" to Color.hex("#B5651D")
         )
      }
      width = 1.5
   }
   layout {
      size = 1000 to 450
   }
}
結果如下:

建立點圖
現在,讓我們在點(散布)圖中視覺化 df DataFrame:
- 呼叫 Kandy 程式庫中的
.plot()函式。 - 套用
points()圖層。 - 將
Month和Temperature欄對應至對應的X和Y軸。 - (選用)自訂顏色、座標軸標籤、資料點大小和圖表標題。
df.plot {
   points {
      x(Month) {
         axis.name = "Month"
      }
      y(Temperature) {
         axis.name = "Temperature"
      }

      color(City) {
         scale = categorical(
            "Berlin" to Color.hex("#6F4E37"),
            "Madrid" to Color.hex("#C2D4AB"),
            "Caracas" to Color.hex("#B5651D")
         )
      }
      size = 5.5
   }
   layout {
      title = "Temperature per month"
   }
}
結果如下:

建立長條圖
最後,讓我們為每個城市建立長條圖:
- 使用
.groupBy()函式依City欄對 DataFrame 進行分組。 - 呼叫 Kandy 程式庫中的
plot()函式。 - 套用
bars()圖層。 - (選用)為圖表新增標題、自訂顏色。
df.groupBy { City }.plot {
    bars {
        x(Month)
        y(Temperature)

        fillColor(City) {
            scale = categorical(
                "Berlin" to Color.hex("#6F4E37"),
                "Madrid" to Color.hex("#C2D4AB"),
                "Caracas" to Color.hex("#B5651D")
            )
        }
    }
    layout.title {
       title = "Temperature per month"
    }
}
結果如下:

後續步驟
- 在 Kandy 程式庫文件中探索更多圖表範例
- 在 Lets-Plot 程式庫文件中探索更進階的繪圖選項
- 在 Kotlin DataFrame 程式庫文件中尋找有關建立、探索與管理資料框架的更多資訊