
使用 Kandy 进行数据可视化
Kotlin 为强大且灵活的数据可视化提供了一站式解决方案,使你在深入研究复杂模型之前,能够以直观的方式呈现和探索数据。
本教程演示了如何在 IntelliJ IDEA 中使用 Kandy 和 Kotlin DataFrame 库创建不同类型的图表。
准备工作
从 IntelliJ IDEA 2026.2 开始,Kotlin Notebook 将不再与 IDE 捆绑,JetBrains 也将不再提供官方支持。 源代码仍可在 GitHub 上获取。
详细信息请参阅博客文章。
要开始学习本教程:
选择 File | New | Kotlin Notebook。
在你的 Notebook 中导入 Kandy 和 Kotlin DataFrame:
kotlin%use kandy %use dataframe在运行任何其他代码单元之前,先运行包含
%use dataframe行的代码单元, 以确保 DataFrame 库及其 API 在 Notebook 中可用。
要学习本教程,你也可以将 DataFrame 作为 Gradle 或 Maven 依赖项使用。
创建 DataFrame
首先,我们创建一个包含要可视化数据的 DataFrame。该 DataFrame 存储了柏林、马德里和加拉加斯的模拟月平均气温:
// months 变量存储包含一年中 12 个月份的列表
val months = listOf(
    "January", "February",
    "March", "April", "May",
    "June", "July", "August",
    "September", "October", "November",
    "December"
)
// tempBerlin、tempMadrid 和 tempCaracas 变量存储
// 每个月份对应气温值的列表
val tempBerlin =
    listOf(-0.5, 0.0, 4.8, 9.0, 14.3, 17.5, 19.2, 18.9, 14.5, 9.7, 4.7, 1.0)
val tempMadrid =
    listOf(6.3, 7.9, 11.2, 12.9, 16.7, 21.1, 24.7, 24.2, 20.3, 15.4, 9.9, 6.6)
val tempCaracas =
listOf(27.5, 28.9, 29.6, 30.9, 31.7, 35.1, 33.8, 32.2, 31.3, 29.4, 28.9, 27.6)现在,让我们创建一个新变量(df),并使用 dataFrameOf() 函数生成一个包含三列(Month、Temperature 和 City)的 DataFrame:
val df = dataFrameOf(
    "Month" to months + months + months,
    "Temperature" to tempBerlin + tempMadrid + tempCaracas,
    "City" to List(12) { "Berlin" } + List(12) { "Madrid" } + List(12) { "Caracas" }
)
要预览数据,请使用 .head() 函数:
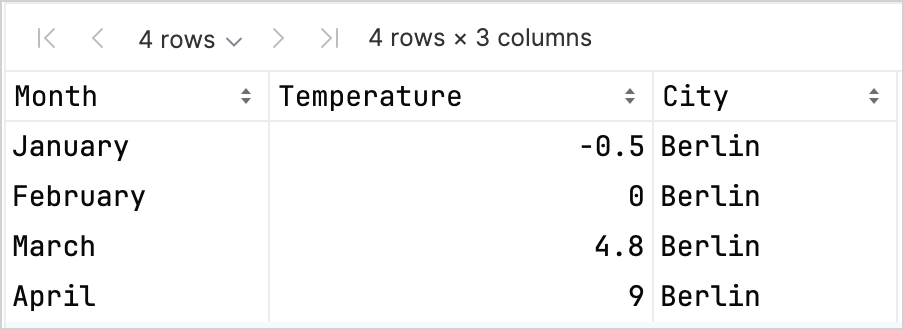
df.head(4) // 返回前四行在我们的数据集中,前四行存储了柏林 1 月至 4 月的气温:
访问列记录有多种不同方式,这有助于你在同时使用 Kandy 和 Kotlin DataFrame 库时提高类型安全性。 欲了解更多信息,请参阅访问 API。
创建折线图
让我们使用上一节中的 df DataFrame 创建一个折线图:
- 调用 Kandy 库中的
.plot()函数。 - 应用
line()图层。 - 将
Month和Temperature列分别映射到X轴和Y轴。 - (可选)自定义颜色和尺寸。
df.plot {
   line {
      x(Month)
      y(Temperature)

      color(City) {
         scale = categorical(
            "Berlin" to Color.hex("#6F4E37"),
            "Madrid" to Color.hex("#C2D4AB"),
            "Caracas" to Color.hex("#B5651D")
         )
      }
      width = 1.5
   }
   layout {
      size = 1000 to 450
   }
}
结果如下:

创建散点图
现在,让我们在散点图(点图)中可视化 df DataFrame:
- 调用 Kandy 库中的
.plot()函数。 - 应用
points()图层。 - 将
Month和Temperature列分别映射到X轴和Y轴。 - (可选)自定义颜色、坐标轴标签、点大小和图表标题。
df.plot {
   points {
      x(Month) {
         axis.name = "Month"
      }
      y(Temperature) {
         axis.name = "Temperature"
      }

      color(City) {
         scale = categorical(
            "Berlin" to Color.hex("#6F4E37"),
            "Madrid" to Color.hex("#C2D4AB"),
            "Caracas" to Color.hex("#B5651D")
         )
      }
      size = 5.5
   }
   layout {
      title = "Temperature per month"
   }
}
结果如下:

创建柱状图
最后,让我们为每个城市创建一个柱状图:
- 使用
.groupBy()函数按City列对 DataFrame 进行分组。 - 调用 Kandy 库中的
plot()函数。 - 应用
bars()图层。 - (可选)为图表添加标题、自定义颜色。
df.groupBy { City }.plot {
    bars {
        x(Month)
        y(Temperature)

        fillColor(City) {
            scale = categorical(
                "Berlin" to Color.hex("#6F4E37"),
                "Madrid" to Color.hex("#C2D4AB"),
                "Caracas" to Color.hex("#B5651D")
            )
        }
    }
    layout.title {
       title = "Temperature per month"
    }
}
结果如下:

后续步骤
- 在 Kandy 库文档中探索更多图表示例
- 在 Lets-Plot 库文档中探索更高级的绘图选项
- 在 Kotlin DataFrame 库文档中查找有关创建、探索和管理 DataFrame 的更多信息